Report customisation
You have the option to customize the graph report to align with your branding. This includes changing graph types, showing or hiding graphs, adjusting graph colors, displaying or hiding tables, customizing table headers, fonts, and more.
Let's delve into this topic and thoroughly discuss all the possible customization in detail.
The following pop up will appear.
- On the dashboard click on the survey for which you want to customise the graph report.
- Click on Reports on the top.
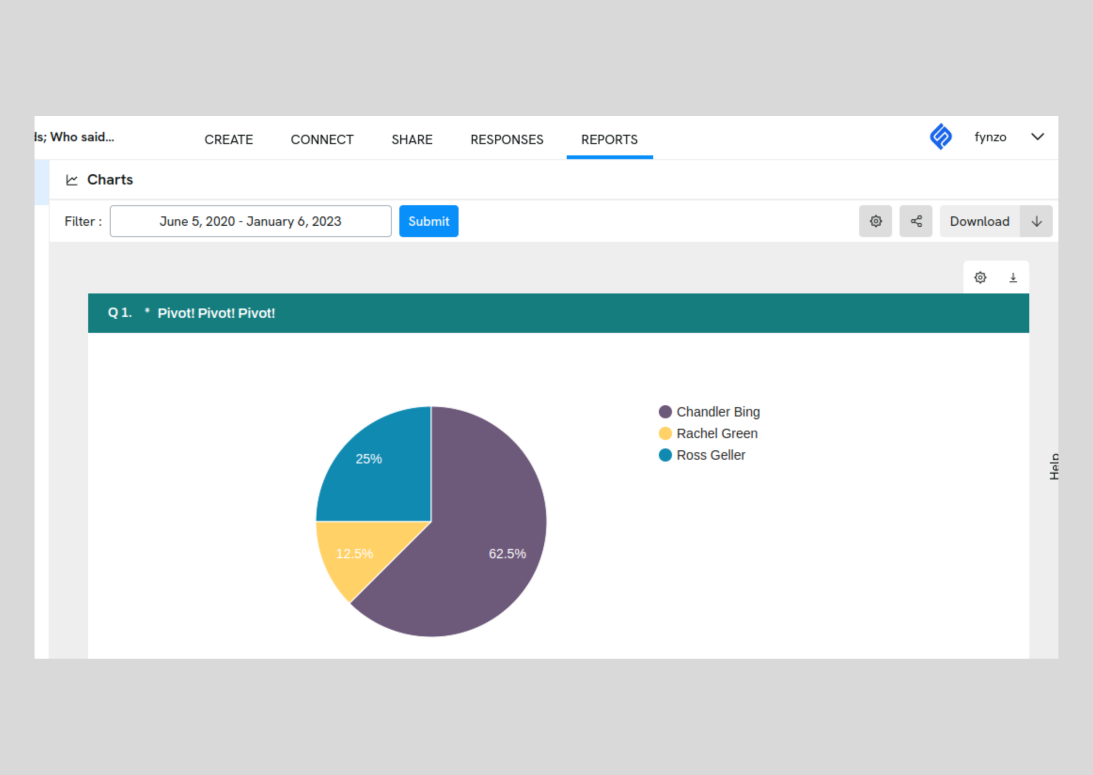
Now you will see the graph report which will look something like the below image:
There are two levels at which customisation can be done to a report.
- Global settings : This setting applies to all the questions in the report.
- Individual settings : This setting applies to a single question on which the setting is applied.
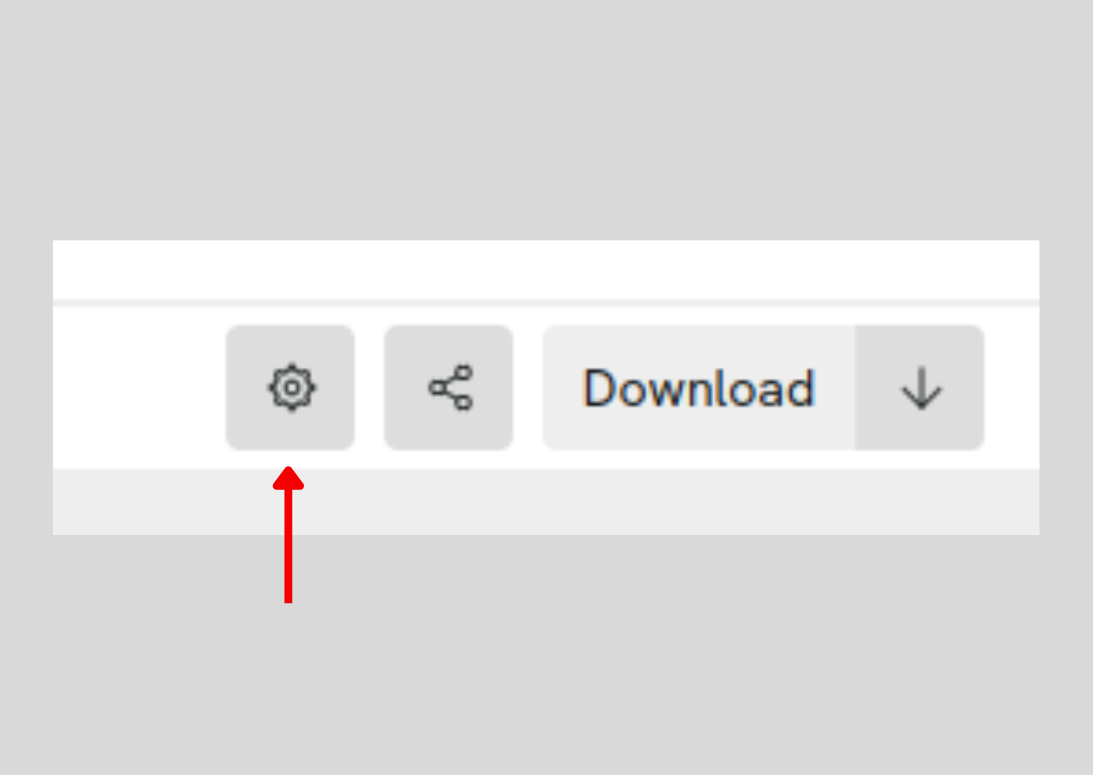
Lets start with the global settings. The global settings can be activated by clicking on the below button on the top right of the screen.
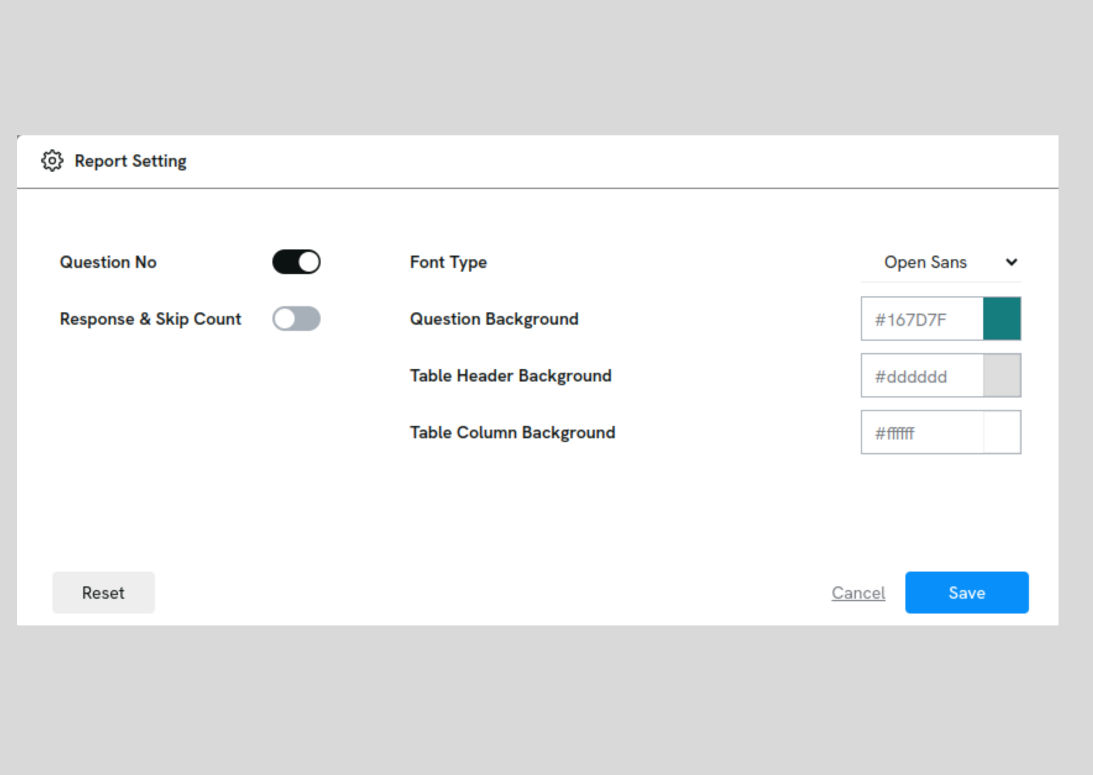
As you click on setting button, a pop up appears as shown below.
As you can see, following are the things that can be altered with globally for all the questions of this report.
- Question No : Switch it on to show question number for each questions.
- Response & Skip count : You can switch on if you want to see the response and skip count for each questions. Response count is how many person actually answered that questions. Skip count is how many person actually skipped that question.
- Font type: You can change the font too. You can select from the list of fonts provided in the drop-down. The font of the question text, table texts will be changed.
- Question background : You can change the background color of the question text. The color of the text will adapt to the background color. Check the example below.
- Table header background : Table header background color can also be customised as per your need. The header text color will adapt to the background color of the header. See the example below.
- Table body background : Table body background color can also be customised. Here also the text color of the table body adapts to the background color. See the example below.
- Reset : This button is used to reset all the setting back to default.
This is it about the global settings of the report.
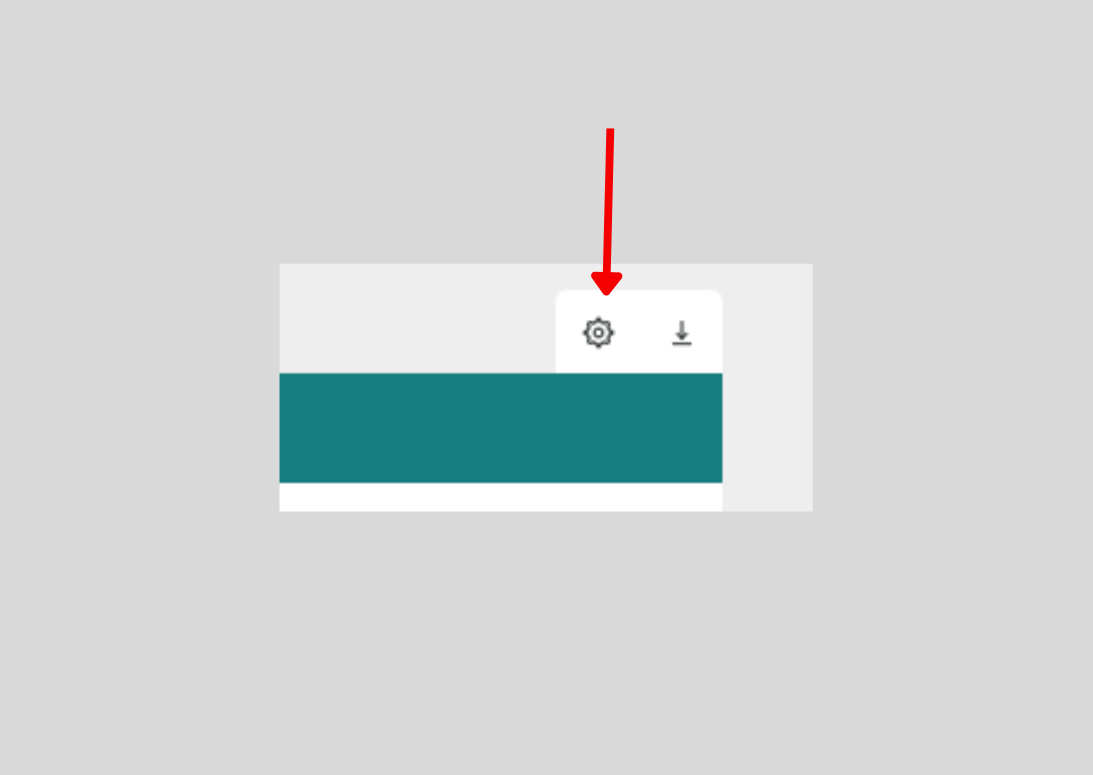
Now we will move on to individual settings. This settings applies to a single question on which you apply it. Click on the setting button of a question (Check image below).
Now we will move on to individual settings. This settings applies to a single question on which you apply it. Click on the setting button of a question (Check image below).
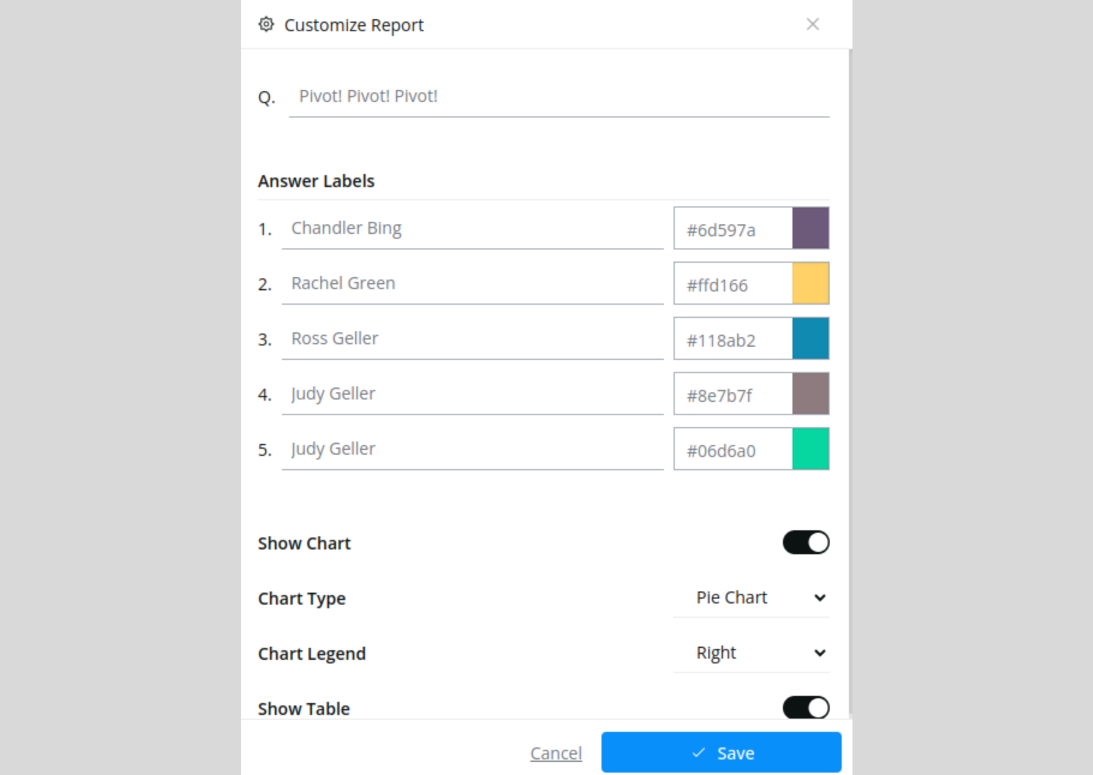
The following pop up will appear.
You can customise question text, choices text, show hide chart, change chart type, change legend position, show/ hide table etc. lets discuss each of them in details.
- Question text: You have the option to customize the question text displayed in the report. Various scenarios may necessitate text customization. For instance, if a question's text is lengthy and you prefer a shorter version in the report, you can make that adjustment here. Similarly, if you wish to generate a report in a different language, you can utilize this feature to modify the text. There are numerous other scenarios where this customization can be beneficial.
- Choice text : If you want to change the text of choices that appears in the report, you can do it from here. For example lets say you want to use the real name of the actors instead of their reel names, you can do it. You can change Chandler Bing with Matthew Perry, Rachel Green with Jennifer Aniston and so on. (See the image below).
After updating the text for choices get updated in the report (See the below image). - Show Chart : If show chart is on the chart happens to appear in the report foe that question. If it is off it doesn't show in the report.
lets switch it off and see how the report looks like.
See below how the report looks like if we hide the chart. - Chart types: There are various types of charts that we support in the report. See below what all charts types are supported.
Lets see how each of the char looks like:
Pie Chart: This is the default chart. Below is an example of pie chart.
Donut Chart: Below is an example of donut chart.
Column Chart: Below is an example of column chart.
Bar Chart: Below is an example of bar chart.
These are the 4 types of charts that are available to choose from. - Chart Legend: This setting helps you customise the placement of the legends with respect to the graph. Please check the available options in the below image.
Right: Shows the legend on the right of the graph.
Top : Shows legends on the top of the graph.
Bottom : Shows legends on the bottom of the graph.
Labelled : Shows the legends with values.
Left : Shows the legends in the left.
None: Does not show the legends. - Show Table : You can show or hide the table of a question. Below is an example of how a report looks like if the table is hidden.
- Graph Color : You can change the color used in the graph. You can set the color of each of the options. See the below image.
The same is reflected in the charts. See the image below.
These are all the customizations available to align your report more closely with your brand.
Related Articles
Schedule response report
With this feature you periodically receive emails containing an Excel file that includes the latest survey responses since your previous report. You can add recipients to the email list who require this data. You can schedule the emails at your ...Viewing graphical report
Following are the steps to view the graph report for a survey. On the dashboard click on the survey for which you want to view the graph report. Click on Reports on the top. . The graph report will load as shown below. That's it. Thank you.Sharing graph report public link
The graph report can be shared with a link. Anyone having the access to the link can view the graph report by opening the link in any browser. To get the link follow the below steps: On the dashboard click on the survey for which you want to share ...Downloading graph report for a survey in PDF format
Once the data is collected there are many ways in which you can view the same. One of the way is the graphical representation of the data. Following are the steps to download the graph in PDF format. On the dashboard click on the survey for which you ...Update the Time Zone
Looking for update your time zone so that Fynzo Survey can function for you accordingly. Follow the following easy steps to update the time zone on Fynzo Survey. Update Time Zone Select your preferred time zone from the dropdown and update your ...